Perfwave offers an agnostic multi-vendor and multi-technology solution.
The Perfwave solution offers operators a customized and scalable tool that supports their growth and helps them overcome their challenges.
Advanced features (SON features such as Minimizing Drive Tests and Energy Savings) deliver both QoS/QoE improvements and OPEX/CAPEX savings.
The various modules in our software suite address the needs of different teams within the operator’s organization: Radio Engineering/Optimization, Design/Deployment, Maintenance/Supervision, Customer Care, and Marketing.
Monitoring
Our platform provides telecom operators with highly adaptable dashboards tailored to their exact needs. By transforming multi-source data into fully customizable visual workspaces, you can seamlessly monitor network performance from a macro group perspective down to a granular cell level.
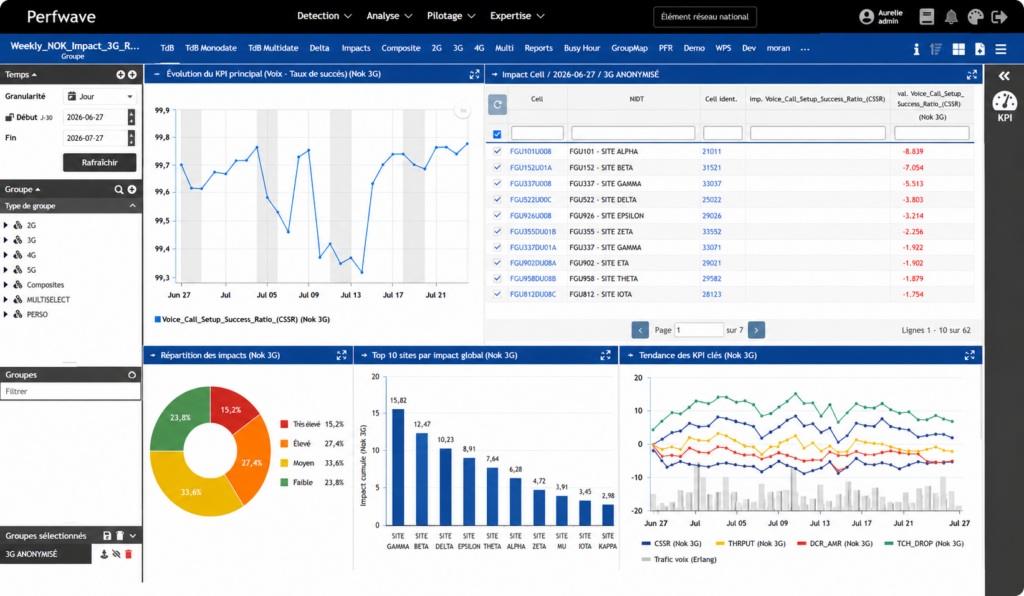
Custom Dashboards
Build personalized workspaces with flexible widgets to fit your exact daily operational needs.
In depth-analysis
From KPI to raw counters, multi-band analysis, correlation between KPI evolution and events (parameters changes, alarms, trouble tickets …)
Multi-Level Monitoring
Track network performance at any scale, from high-level group views down to individual cells.
Automated Reporting
Schedule custom reports based on your dashboards or grids, automatically delivered directly to your inbox.
Builder
Data correlation & extraction tool: create your own queries for correlation from multiple sources (topology, KPI, detection, configuration, alarms, etc.)
Detection
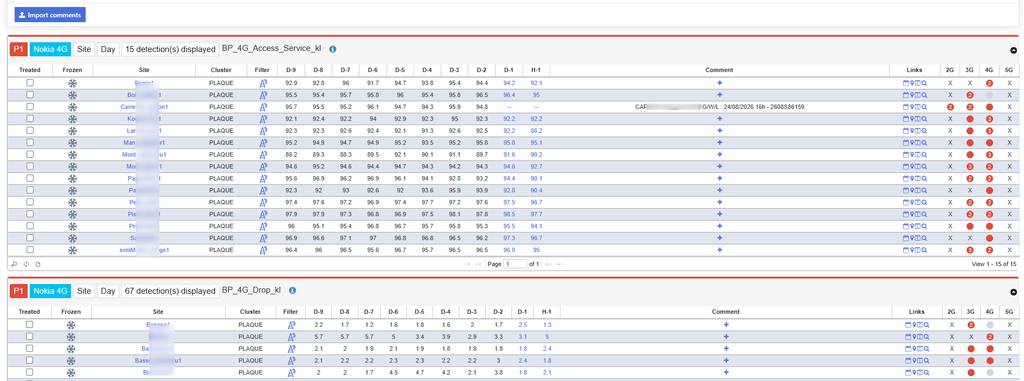
Detection Grid
Allows the operator to configure and run alerts (thresholds, occurrences, or more complex algorithms) for all temporal and spatial granularities.
All detection results can be viewed in a dedicated GUI or can be sent automatically via email.
Cell impact
A powerful algorithm that quickly identifies the most impacting cells in any area. This feature is highly effective for prioritizing maintenance or optimization tasks, with a focus on customer satisfaction within this area.
Audit
Module designed to simplify and automate the management of radio parameter configurations.
Comparing the reference templates with the settings actually implemented on the OSS side
Generation of scripts in OSS format for parameter alignment
Supervision
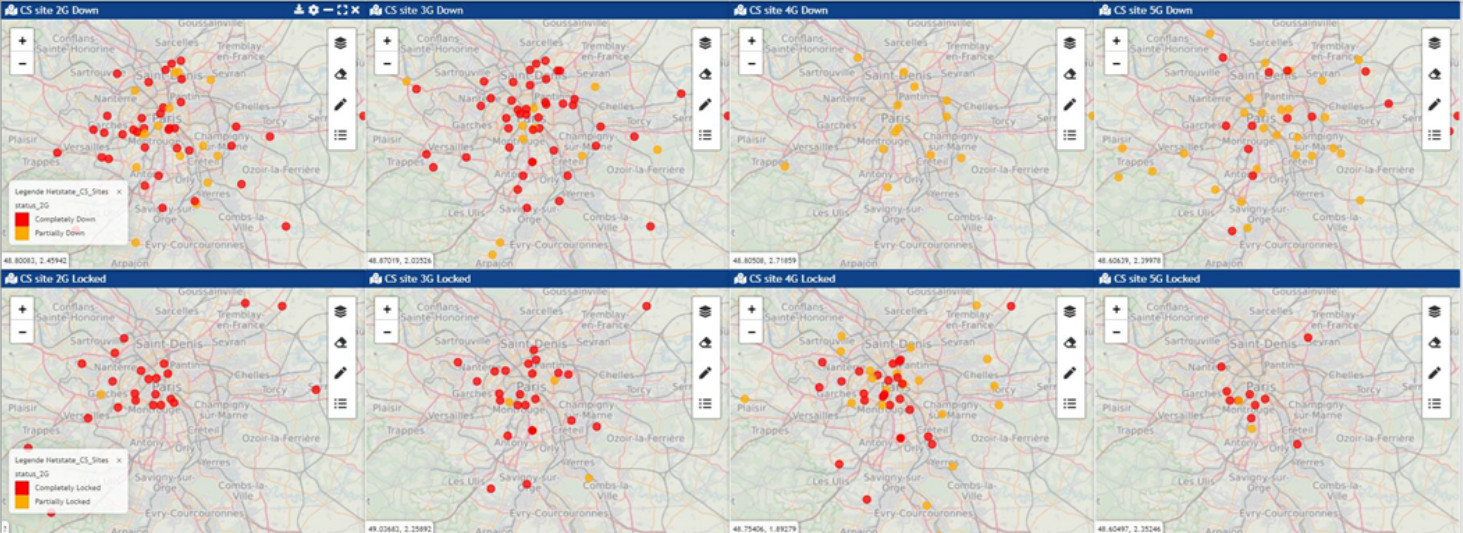
Netstate
Provides supervision teams with a fast, efficient and clear overview of the operational states (lock, down) of the sites
Particularly useful for scheduled events (Olympic Games, concerts etc.) or unscheduled events (storm, earthquake, etc.)
Tabular or map view in near real-time, practical on a monitoring screen or supervision TV
Alarms
Based on Fault Management data, alarm reporting, analysis of alarm recurrence, and correlation with KPI degradation
SWAP
In the event of a vendor swap, this ensures that service quality is maintained between the old and new vendors
Automation & SON
Streamline your daily operations with our targeted automation features. Our platform continuously monitors your network to detect anomalies and provide optimizations in close or open loop mode.
Energy Saving
Smartly manage and automate network power consumption during low-traffic periods without compromising the end-user experience.
Parameter clash resolution
Automatically detect critical network conflicts (PCI, RSI, and SC conflicts) and resolve them locally within a zone or globally across the network
ANR
Streamline operations by automatically managing and optimizing neighborhood relationships to ensure the highest quality of service.
Automated diagnostics
Leverage NADIA, our AI assistant, to generate preliminary diagnostics and support your teams in identifying potential network anomalies.
MAP
Leverage comprehensive Geographic Information System (GIS) capabilities to visualize your network data. Our interactive map provides standard GIS functionalities while empowering you to build custom layers for highly tailored spatial analysis
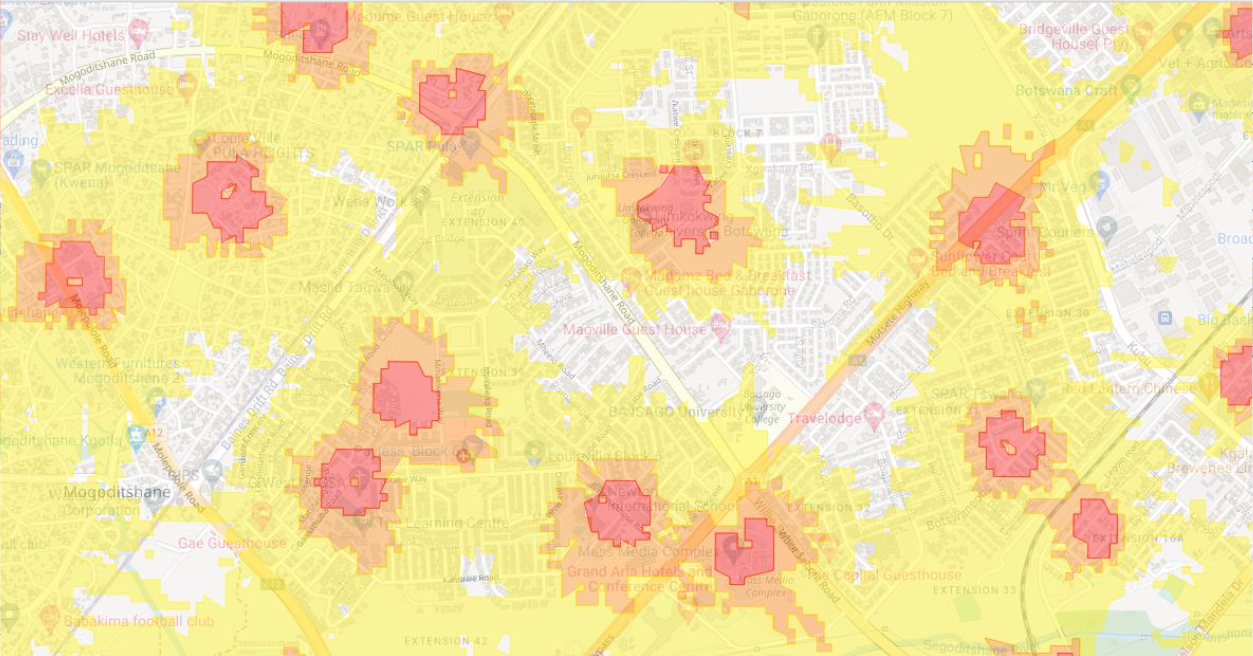
Network Topology
Visualize the physical and logical layout of your network infrastructure directly on the interactive map.
Coverage
Accurately map and analyze signal reach and service availability across any selected region.
Neighbor relations and HO flows
Display and analyze cell neighbor relations on the map to optimize handovers and ensure network continuity.
Heatmap and GIS Layers
Generate heatmaps of any KPI at cell or cluster level.
Import and overlay your own custom geographic data layers to conduct highly tailored spatial analyses.
MDT
Minimization of Driving Test (MDT) is the game changer feature for geolocated performance.
This crucial feature allows operators to collect valuable network performance data directly from user equipment, significantly reducing the reliance on traditional, expensive, and time-consuming Drive Tests.
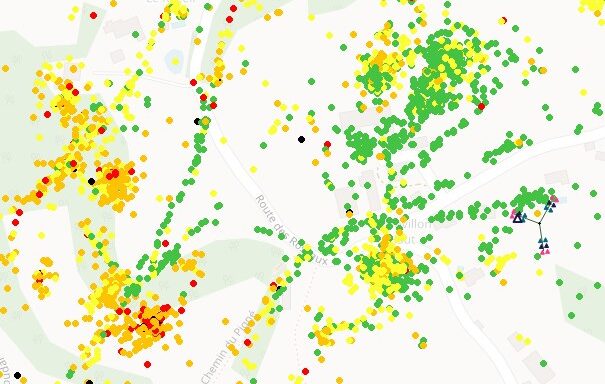
Heatmap using MDT data
The MDT data (RSRP/RSRQ) can be used at different levels: raw data, cell / sector / site footprint, heatmaps per cell or per mesh. This provides the operator with a coverage map based on real customer data.
Weak zone (RSRP/RSRQ)
Automatic detection of weak zones: bad-coverage or bad-quality areas.
Correlated with population density within the area of weakness, allowing the operator to prioritise treatment.
QoS Axes
Enables precise monitoring of quality along the axes (motorway or railway line)
Useful for optimizing QoS axes and meeting regulatory obligations
Overshoot
Automatic detection of the overshooter cells which cover much further than their expected coverage zone
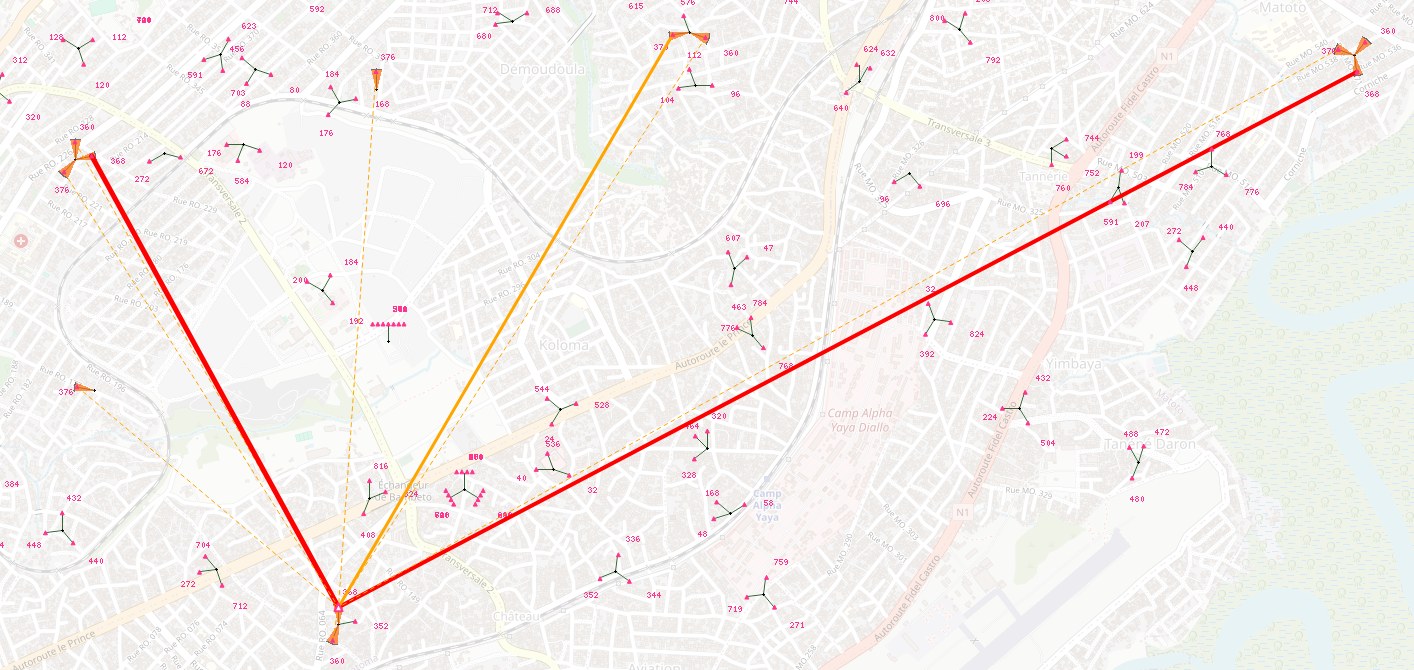
Cross-Sectors
Automatic detection of cross-feeders (X-sectors) enables targeted field interventions; cost reduction and significant improvement in QoS/QoE in the area affected by the site.
Interferences
Automatic detection of interference zones by frequency band
Make the best of your mobile network.
Connect your data sources, gain complete clarity over your multi-vendor infrastructure, and empower your engineering teams.